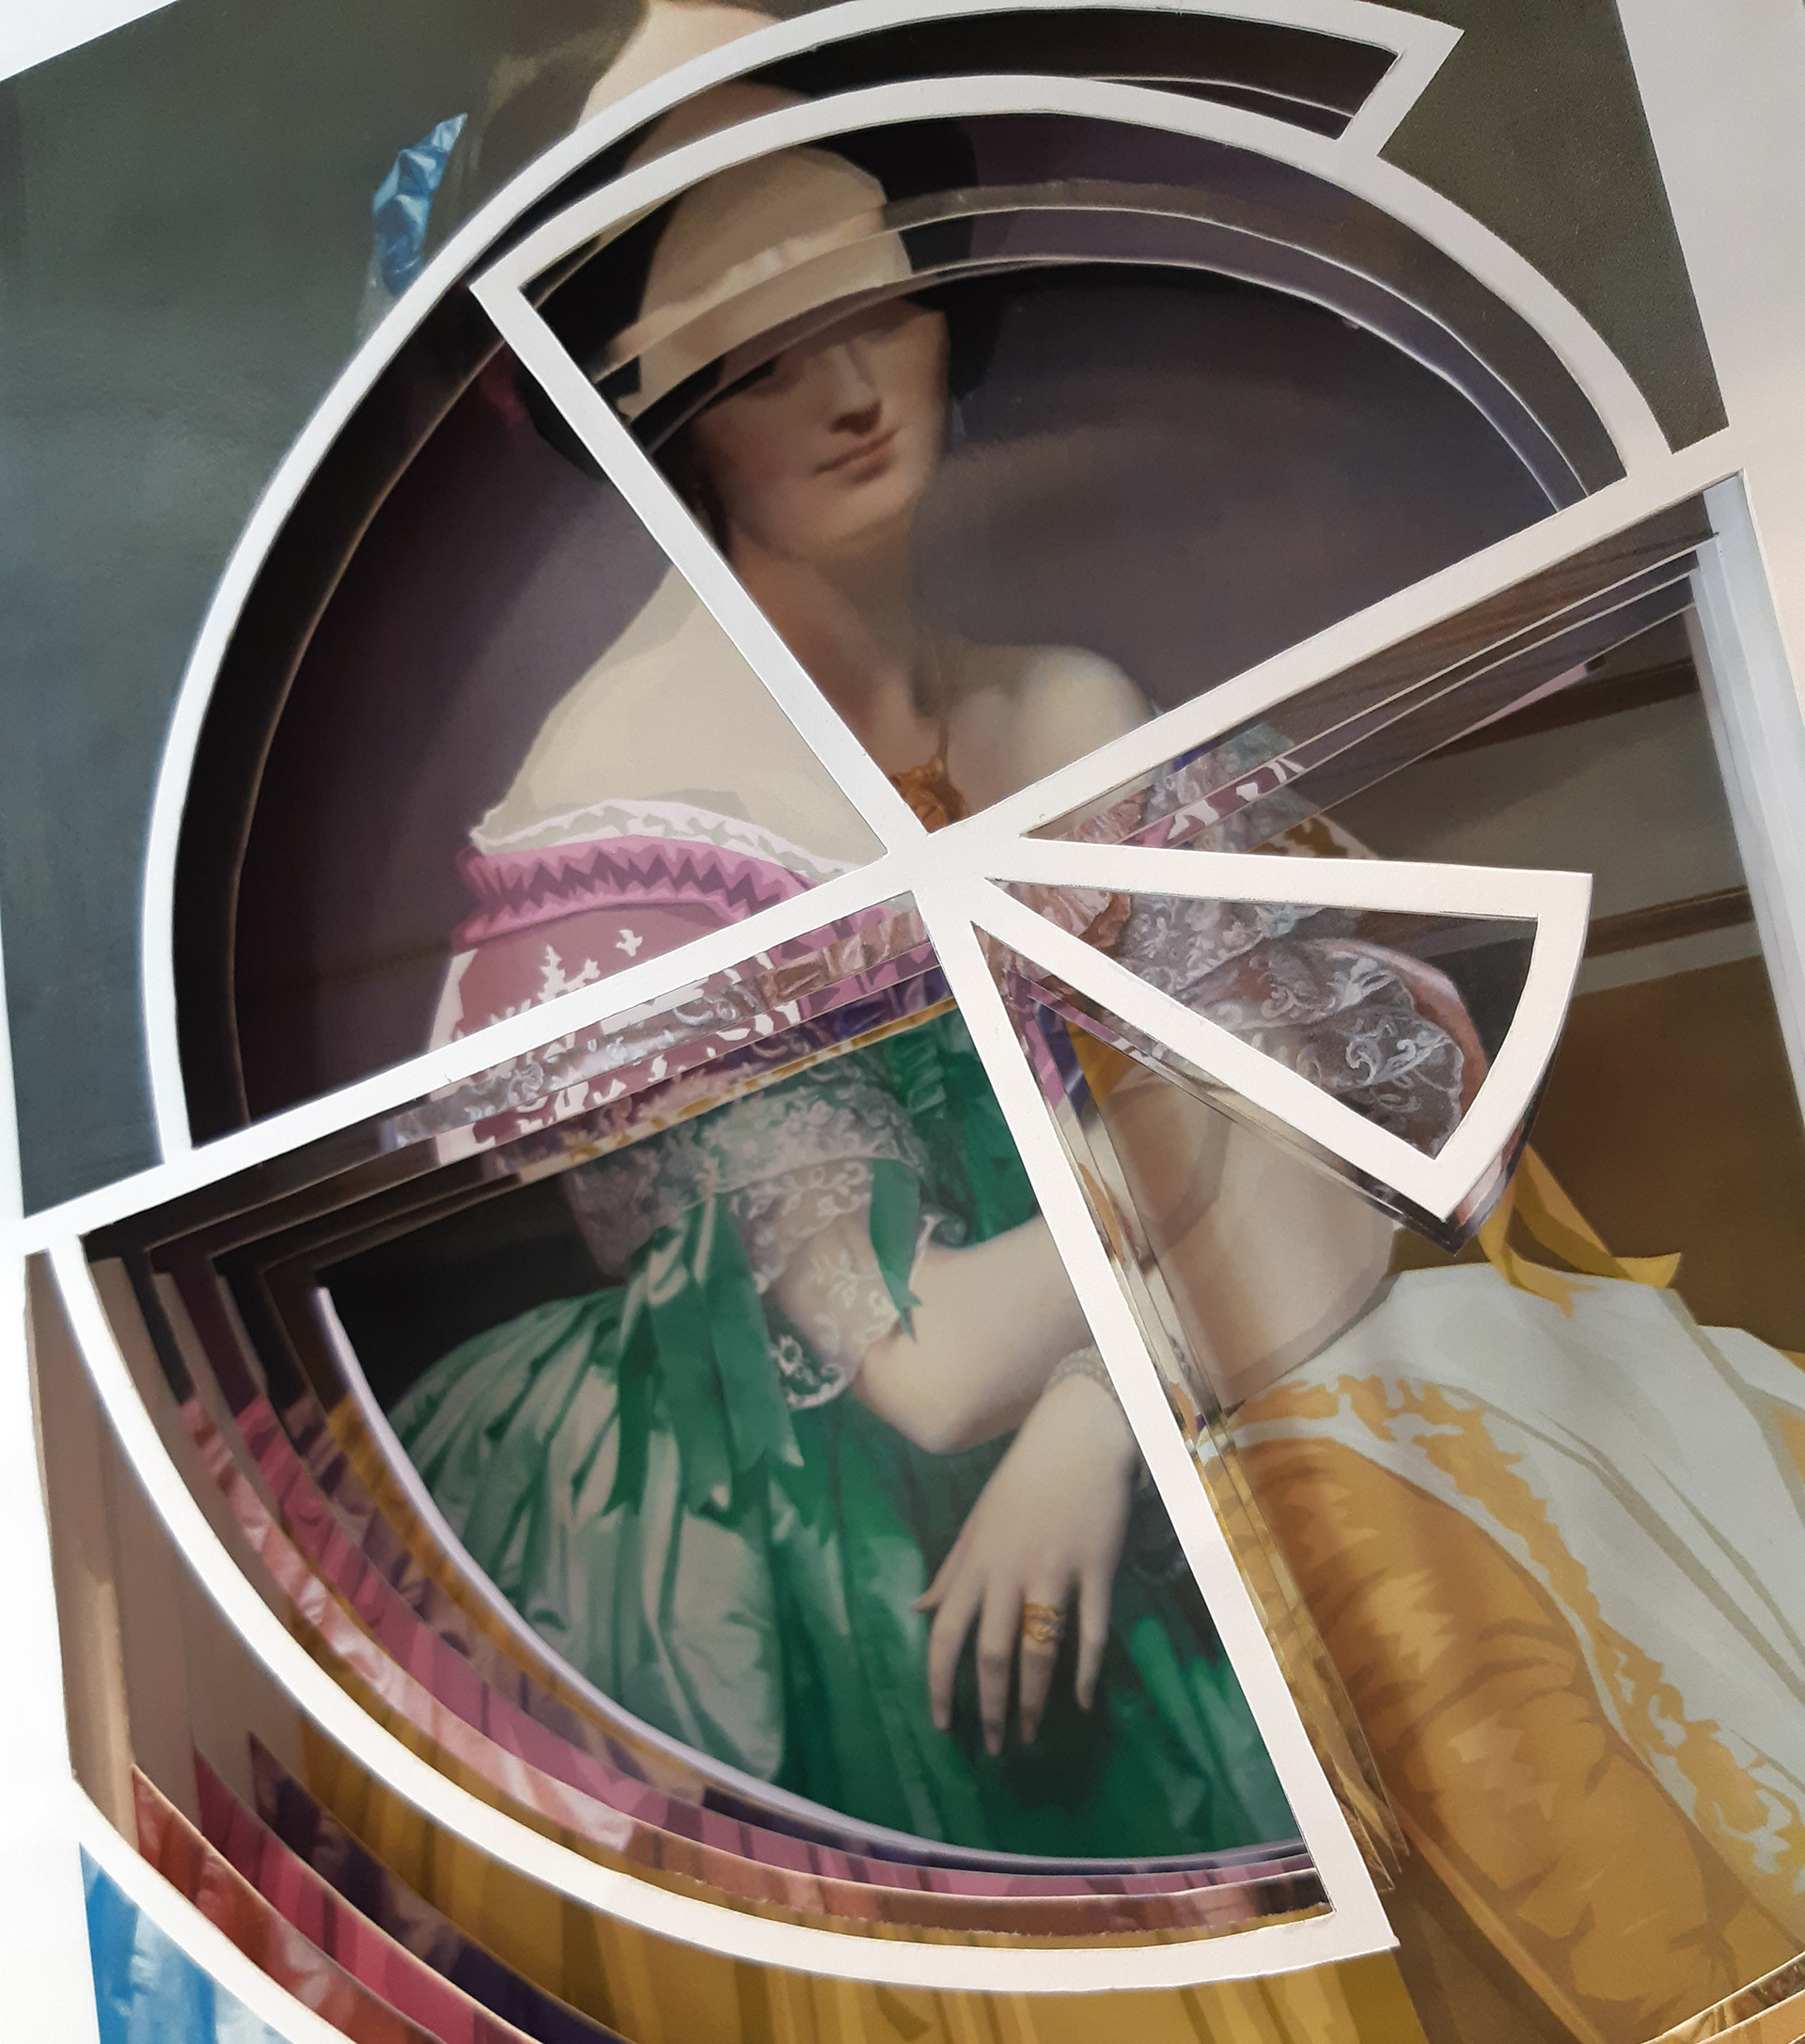
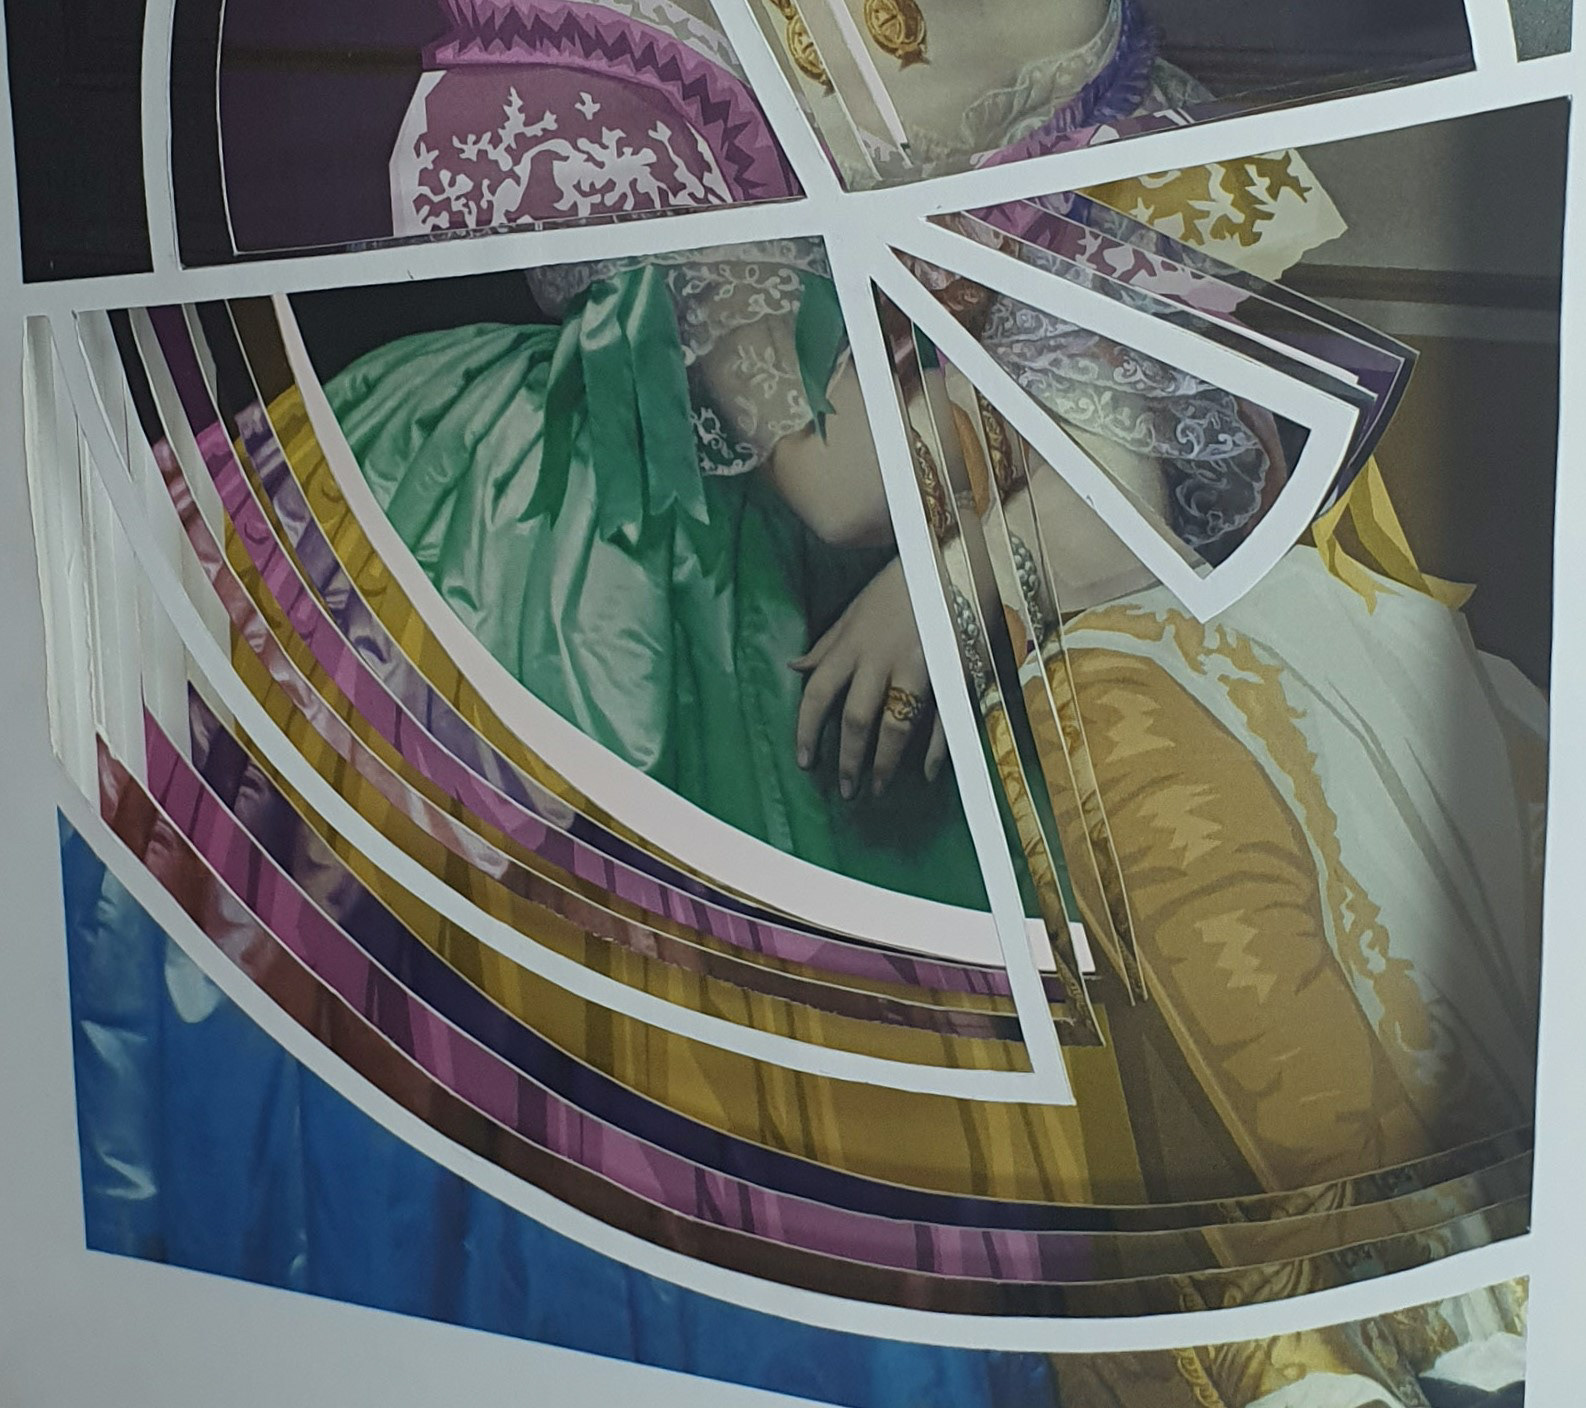
A layered chart diagram displaying the common practices of online image sourcing, using data from the Online Copyright Infringement tracker survey.
The data showed that 51% used Google Images, 45% used social media platforms, 39% used other websites, 29% used free websites, and only 9% payed for the images they utilised.
This data stood out to me due to the dramatic numbers between blind use of Google Images and those paying for rights.
The artwork featured in my work is "La Princesse de Broglie" painted by the French artist Jean-Auguste-Dominique Ingres around 1850.
I chose this painting after coming across a modified poster version, after which I found it could be used freely in the Public Domain.
This sparked my curiosity around fair use and prompted me to dive deeper into copyright.
Researching questions around the concepts of authorship and copyright lead me to create my own replica of the artwork, visualising the intertwined concepts of utilising other’s work, replication, and original work.
Superimposed on one another, each layer symbolises a distinct statistic from the above chart.


